What does a relationship map show?
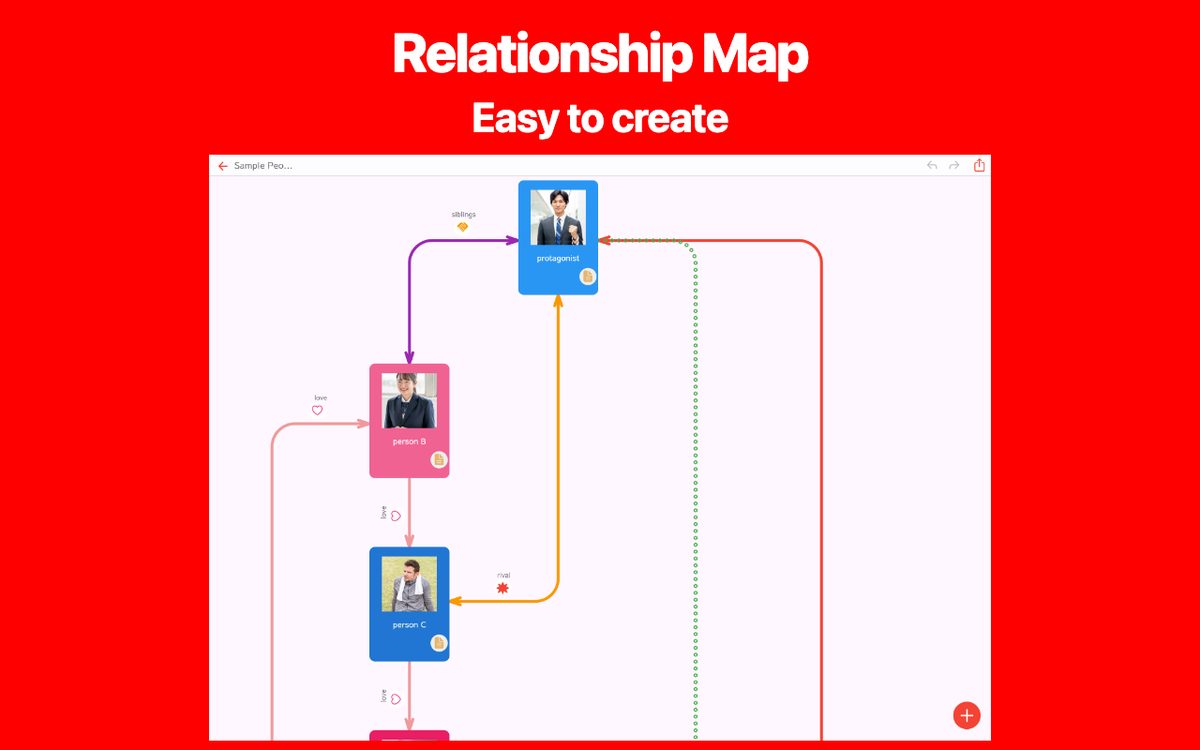
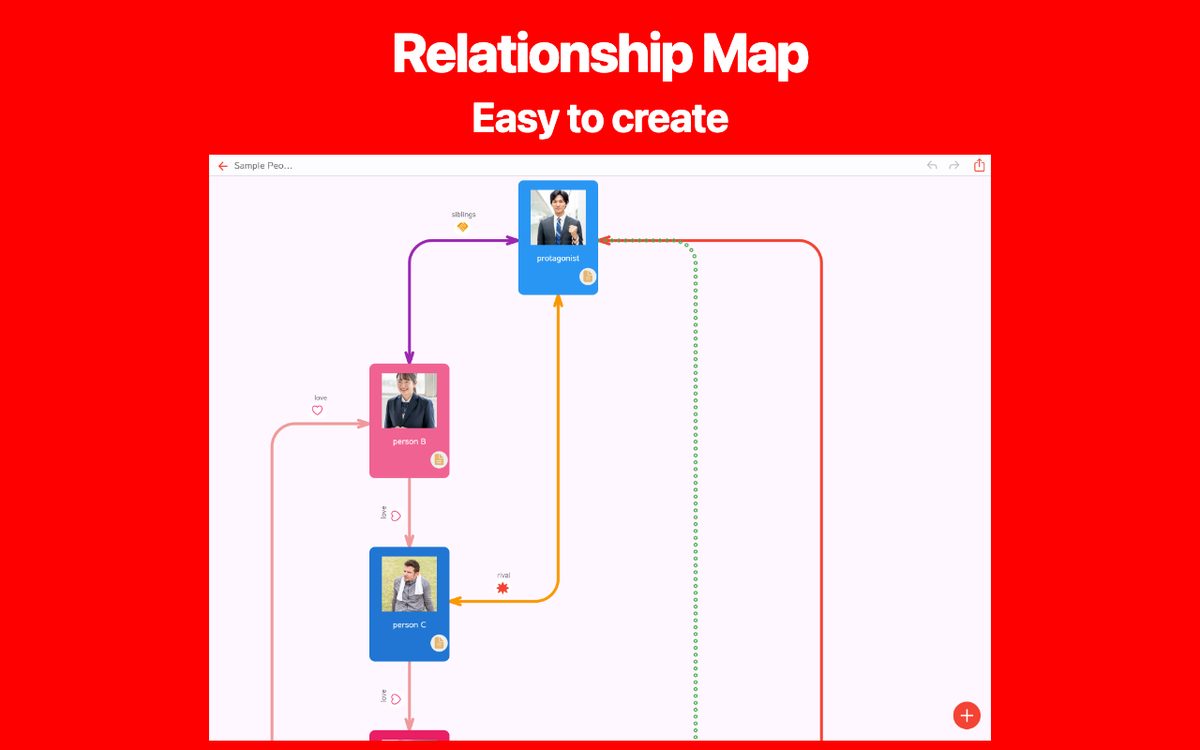
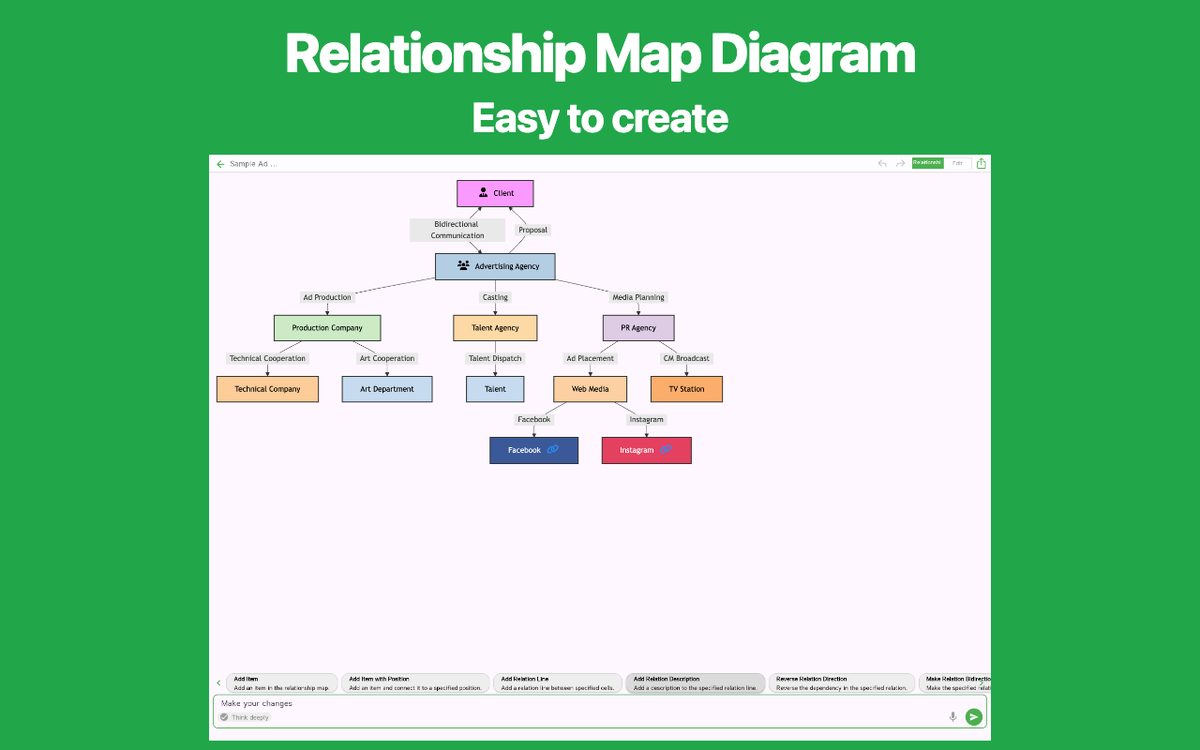
A relationship map shows how multiple entities—such as people, teams, organizations, or concepts—connect and interact with one another. It focuses on clarifying structures, dependencies, and influence across an entire network.
By placing elements on a canvas and linking them with labeled lines and arrows, you can quickly understand who collaborates with whom, where dependencies lie, and how influence flows.
Entities (Nodes)
People, departments, companies, or concepts that take part in the network.
Connections (Lines and arrows)
The direction and nature of the relationship, such as reporting, cooperation, or rivalry.
Labels and attributes
Roles, descriptions, and statuses that add context to each link.
Why is a relationship map necessary?
In modern projects and organizations, relationships are rarely simple. When multiple stakeholders, partner companies, and internal departments collaborate, text descriptions quickly become overwhelming.
Without a visual map, team members often carry different mental models of who is responsible for what. Drawing the network brings hidden assumptions to light, reveals isolated roles, and ensures everyone shares the same understanding of the situation.
Prevent misunderstanding
A single diagram gives the entire team a shared reference point.
Reduce cognitive load
Seeing connections visually is much faster than memorizing complex lists.
Spot isolated elements
Identify key decision-makers, bottlenecks, and neglected handoffs before issues arise.
When is a relationship map useful?
Relationship maps can be used in many scenarios, from business project planning to creative writing and personal networking.
Project stakeholder management
Clarify the relationships between clients, project managers, technical leads, vendors, and end users.
Organizational and cross-team collaboration
Map cross-departmental working groups, reporting structures, and internal collaboration channels beyond a traditional hierarchy.
Business partnerships and market landscape
Diagram partnerships, supplier networks, investment ties, and competitor dynamics in your industry.
Character relationship charts
Keep track of complex interactions in novels, screenplays, history, or community groups.
Benefits of creating a relationship map
Transforming vague mental connections into a clear diagram provides immediate advantages for communication, planning, and problem-solving.
Instant big-picture clarity
See who holds influence and how information moves across the entire network at a glance.
Faster onboarding and explanations
New team members can grasp complex project structures in minutes rather than days.
Early detection of structural issues
Catch single points of failure, overloaded liaisons, or contradictory instructions early.
Better decision-making
Discuss strategies while pointing at concrete connections rather than relying on abstract impressions.
Tips for drawing a clear relationship map
A great relationship map is simple and focused. Avoid overcrowding the canvas by starting with key entities and refining the layout step by step.
Start with the central node
Place the primary person, project, or organization in the center and arrange related parties around it.
Use meaningful labels on arrows
Always indicate what connects two entities—such as "Reports to," "Collaborates with," or "Provides service."
Group related elements by color
Use distinct colors or containers to separate internal teams, external partners, and clients.
Create your own relationship map
Choose a relationship map app that fits your needs. Explore manual editing and AI-assisted generation on each app page.